We’ve been reporting price gains throughout 2012 and new sales numbers for January 2013 by the Florida Association of Realtors bears this out. We’re changing once again how we report numbers and going back to the Florida Assoc of Realtors data for a simple reason.
As of today we still have data from the Cape Coral and Fort Myers MLS. Sometime down the road Cape Coral is going to pull out of a technology venture so the MLS’s will be separate. While it’s not a big loss, it will affect less than 10% of the sales data. I like to report apples vs. apples and when the change occurs later this year, it will be apples Vs apples with a bite or two taken out.
New Sales Numbers Show Price Jump in 2013

So let’s focus on what we have. Pending sales are up about 24% over last year which could lead to some nice closed sales figures when we’re all done. Average price is up over 6% while median price is up over 24%. This tells me there is breadth to this market and the rise is widespread.
Days on the market are down 5 days. Essentially, if something is on the market, available to be shown, and priced correctly, it will sell. The Avg percent of list price/sold price is up as well. The higher priced homes skew this number lower.

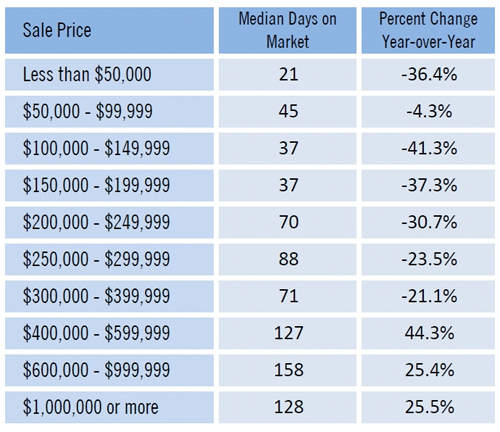
Not all homes sell at the same rate. Let’s look at Avg days on market by price range. As you can see, the lower the price generally results in lower the days on the market. This can be for a few reasons.
First off, there are more buyers at the lower prices. 1st time home buyers, lateral buyers, baby boomers, and investors compete at the lower end. There are only so many luxury buyers out there.
Additionally, even though an investor may be able to afford higher priced homes, they tend to look at return on investment. The lower priced homes return a cash flow not seen in some higher priced homes. There is a limit to what some homes can rent for. Taxes, HOA fees, mandatory club fees, etc all eat into an investors return which caps what they’ll pay for certain properties. This leaves many higher priced homes to end users which limits the market and the buyer pool.
Some higher priced homes rent well. Some have limitations as to how many times per year they can rent.
The bottom line is our market is recovering price wise. We still receive calls from sellers who want too much for their home. Of course, we still receive calls from buyers wanting a home close to the beach, with a pool, under $100,000 too. In any market there will always be people who want to sell for more than the market will pay and those that seek to underpay. The market seeks its own level, and the key to successfully navigating the market is understanding where it’s at.
Our market is kind of like the ocean. Tides come and go, and sand bars move with each passing storm. A wise captain has a depth chart and depth finder, because charts are mere guides to the waters as tides rise and fall and sands shift.
Our real estate market is subject to ebbs and flows like the tides, and an occasional storm which shifts the bottom. The key is to not run aground and get from point A to point B. If you’re finding it difficult to tell where the bottom is or where the tides are heading, please give us a call. We have the latest depth finder and our captains are the best in the business.
Our depth finder is the MLS and our captains are our agents who read charts everyday and will help you interpret the market. Our market is constantly moving so it pays to work with people who understand the changes. If we can help, call us at 230-489-4042
Good luck and Happy House Hunting!
Search SW Florida MLS for Free