Take a good look at the graph. Headlines next week when official numbers are released may report that sales were down versus December numbers, and this would be true. However, preliminary sales numbers we track indicate January 2011 sales mirror very closely January 2010 sales, and pending sales are on the rise again. Last year’s graph showed rising sales peaking in March and holding fairly steady through June. This seems entirely plausible as Southwest Florida typically experiences seasonality in the market, and the pending sales bear witness to potential closings going forward.

2010-2011 SW Florida Home Sales Chart
Single Family Home Sales SW Florida 2010-2011

Pending sales countywide in February aren’t quite at 2010 levels but they’re close. Currently we have 2,704 pending sales in the Greater Fort Myers and Bonita-Estero Association of Realtors MLS compared to 2,758. Pending sales in just Fort Myers and Cape Coral are off a little bit more, but in any event we expect to see rising closing numbers as we go through season.

In fact, our Current Market Index now stands at 4.18, down from 4.66 last month. We developed this index to measure pending sales activity against inventory levels to determine strength or weakness in the market. In years past, sometimes sales were down simply because there were few homes on the market, not because the buyers weren’t ready willing and able. We account for this in our index.

Current Market Index-SW Florida Real Estate
SW Florida Current Market Index

Listing inventory is down slightly in both single family homes and condominiums. Prices last month rose about 3% and we wouldn’t be surprised to see them rise again, although we didn’t specifically study prices for this report. As foreclosure sales fell 12.50% this past month, it’s natural to assume less low end homes sold which would help push the median price up. Additionally, short sales fell 7.45%

Banks have pulled many foreclosures from the docket until they have more time to check their paperwork; Most of these homes will eventually come back to the market. In a perfect world we’d like to see the banks increase their efforts in selling via short sale. Citi Mortgage and Bank of America have done this and are promising faster turnaround times. We have noticed a distinct difference in the turnaround times at Bank of America and Citi has a new program rolling out now.

We’re keeping an eye on some interesting trends. Lehigh Acres distressed sales are continuing to rise to 73.85% of all Lehigh sales, while Fort Myers remained steady at 56.64%, down slightly from 57.19% the previous month. Cape Coral distressed sales were at 66.27% in January, up from 61.13% in December.

We expect Season to be very strong again this year. The national economy is picking up a bit. It will be interesting to see how the economy, interest rates, and bank owned inventory affects the market in the 2nd half of 2011. The first half’s course is pretty well set.

Topagent.com QR Code
QR Code Topagent.com

It’s been a few months since we’ve reported numbers for the Current Market Index, so here is the update.  The Fort Myers-Cape Coral area index now stands at 4.02, up slightly from 3.86 in September and 3.81 in August.  The lower the index numbers the better the market for sellers.

This is a result of slightly rising inventory numbers, but very much in line with inventory numbers back in August.  We’ve seen continuous dips in inventory for quite a few months leading up to October, and this is the first month we’ve seen a slight increase.  Pending sales are down ever so slightly as well, however nothing that is statistically significant.

Current Market Index SW Florida Real Estate

Existing sales are holding up nicely and still showing healthy gains over last year.  Buyer interest from around the country is strong.  In fact, our team has so many buyer leads coming in that we need to hire 4 more buyer agents to keep up with the activity.  We think season this year is going to be very strong.  Temperatures up north have been unseasonably cold this fall and it’s looking like they could have a long and cold winter.  Traditionally this is always good for the Florida market as snow-birds look for a tropical escape and potential property purchase.

The snow-birds we’ve talked to are already motivated to purchase.  They witnessed first hand that some properties are up about 20% in price over last year as the pickings are getting slim in certain segments.  They realize this season may be the last season to pickup many of these bargain basement priced properties.

We’re seeing waterfront properties in the Cape for example bouncing off their bottom last year for entry level direct access properties.  We’ve also seen a bottom in Cape Coral for entry level homes, especially pool homes.  This has fueled an increase in sales in the Fort Myers and Lehigh Acres market. Fort Myers home sales in September increased by 6 sales. Cape Coral lost 35 sales versus the previous month.  Lehigh Acres gained 7 sales versus September.

As sales potentially shift from the Cape over to Fort Myers and Lehigh Acres, we could see a bottoming in prices there as well.  You’ve heard the term that water seeks it’s own level.  As prices get too high in a given area, buyers shift their focus to other more affordable areas.  Many have preferred to live in Cape Coral over Lehigh Acres, but in the run-up back in the early 2000’s, prices in the Cape got so far ahead of Lehigh Acres that buyers shifted to Lehigh for the value, and thus a boom began in Lehigh.  As foreclosures hit hard, many buyers scooped back into the Cape for the bargains and preferred the Cape over Lehigh all else being equal.  Because we’ve sold many of the Cape foreclosures, the bargains are not there like they used to be, so we’re seeing this shift to wherever the bargains are.

We’re still in a bargain market for the time being, but that could change.  Northerners are starting to fear that the bargains are drying up and they don’t want to miss out, so this season could get very exciting.  It’ll be interesting to watch where the money goes, and what happens when the foreclosure well starts to run dry.  How will that affect the overall market?

Speaking of foreclosures, it appears banks are cranking up the process on a whole new batch of foreclosures.  Some have speculated that banks purposely waited until the end of 4th qtr which ended Sept 30 to file these new lawsuits so their books would look better.  Wall Street has a history of doing this for earnings and results.  A friend of mine has even speculated banks are keeping losses off their books this year to pad their earnings so they can collect bigger bonuses.  There may be some truth to that.

Last year we saw a spike in Lis Pendens filings for precisely the same theory.  We’ll have to watch the November and December filings to get a feeling if this is another Wall St accounting trick of holding back what they can, and thus the October spike, or if this is a long-term trend.  If this is a long-term trend, then it will stall increase in prices.  If this is merely a short-term blip like last year, we could see fewer bargains and more actions from northerners fearful for missing out on one of the best buying opportunities in awhile.

Just like back in 2005, you cannot calculate the absolute top of the market until it’s in your rear view mirror.  Timing the bottom of the market is much the same way, and in fact we’ve seen a bottom already in certain segments.  The entire market doesn’t always move in unison.

Our advice to buyers is simple.  Regardless of whether this is the absolute bottom, we’ve already seen the bottom, or we have a little bit more to go, prices are bargains right now.  You may not want to miss this general time period, because one day soon we may look in the rear view mirror and kick ourselves for missing the buying opportunity of a lifetime.  All the bank’s misery and misfortune can now become your gain.  Somebody is going to capitalize on this misfortune.  Why not you?

About 8 years ago the Ellis Team created a market index that accurately predicts the SW Florida real estate market. It helped us in 2005 warn the public that the local real estate market was about to turn.  Later in the fourth quarter and on into 2006 people began to realize the train had run out of steam.  We named it the Ellis Team SW Florida Current Market Index.  Since unveiling this index, the National Association of realtors came out with a similiar index called the NAR Pending Home Sales Index, which also predicts future closing activity, but it doesn’t measure the overall health of the market.  

Current Market Index SW Florida Real Estate by the Ellis Team

 Our local index measures pending sales, but also takes into account listing inventory and measures the overall health of one against the other.  It tells us if properties are moving relative to overall supply.  This is important because in a good market, it may actually be more of a seller’s market than people realize.  In a hot market, sales are held back by the supply, meaning if there were more supply, chances are, there would have been more sales. 


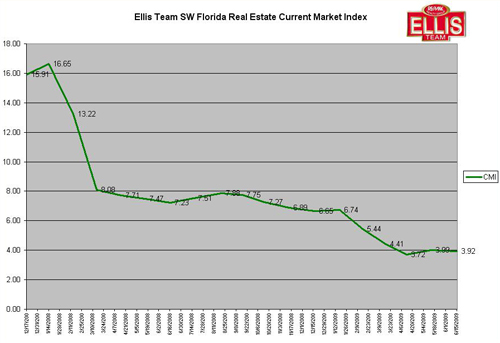
The CMI Index numbers peaked out in January of 2008, and back then we started telling the public sales were about to pick up and inventory would start declining.  Sure enough, that’s exactly what happened throughout 2008 and into 2009.  Our Index was at it’s lowest in April of 2005 and at it’s highest in January of 2008.  The higher the index number, the more of a buyer’s market it is and the lower the number, the more of a seller’s market we have.  Back in July of 2005, the overall Lee County Index stood at only 1.07.  As we know all too well, that was about to change drastically.  The numbers shot up to 2.11 by September 2005, and 3.44 by October.   

So what do the numbers tell us today?  Our index hit 3.72 in April and stands at 3.80 in July of 2009.  This tells us inventory levels have been decreasing as predicted and pending sales have been increasing, as predicted.  In fact, last month we sounded the alarm that June sales could reach record levels, and they did.  July’s numbers when released should be strong as well.  Don’t confuse this with rising prices just yet.  The market is strong in sales volume, but we’re in a new market that has reset, and prices aren’t going back to 2005 levels.  We are starting all over from scratch and 2009 is the new baseline, and as the market heals, the baseline will have room for future price appreciation, with moderation. 

We update this graph each month on our Blog, blog.topagent.com and we look forward to providing this insight to News Press readers in the months to come.  Its one thing to have a Feeling about what the market is doing, however really studying the actual facts and charting trends helps to better understand what the market is actually doing, and where it may be headed.  Nobody can know with absolute certainty what will happen in the future, so we look to statistics to give us our best guidance.  Statistics are our radar so to speak.   

We really try to look at the data with an unbiased eye, meaning we’ll let the data speak for itself and tell the story, as opposed to hypothesizing what the story should be and trying to prove it.  We’ve been right, and we’ve been wrong, and the point is we’re not attached to the outcome of our predictions.  We simply lay it out there and let you decide based upon the best facts we have at the time. 

We’ll be running a new batch of numbers soon, but the July Index appears to show a strong market going forward for the next few months.  It looks like July and August sales numbers should be in good, and we look forward to the release of official numbers on August 21.  We won’t be surprised if July’s numbers are big, perhaps up as much as 100% or so, but down slightly from June’s record numbers.

As printed in the Fort Myers News Press August 15, 2009


The Ellis Team SW Florida Real Estate Current Market Index for June 2009 shows another slight improvement, down from 3.99 to 3.92  Remember, the lower the Index number, the better for sellers, and if you’ve followed this index for any length of time you’ll discover that it’s been very accurate forecasting the foreward movement of the Fort Myers real estate market and the Cape Coral real estate market.

Ellis Team SW Florida Real Estate Current Market Index June 2009


Inventory fell from 12,579 last month to under 12,000 for the first time in a long time.  Inventory levels have been falling for awhile and pending sales have remained relatively stable, helping to draw down inventory levels.  Cape Coral inventory levels are very low, but so is Lehigh Acres copared to the pending sales.  Lehigh Acres has traditionally followed Cape Coral, and as the Cape’s prices have gone up in the entry level home market, Lehigh Acres demand has increased, just like in the run-up of the roaring 2000’s.

The Ellis Team are Top agents at RE/MAX Realty Group in Fort Myers Florida and study the SW Florida real estate market in great detail.

Fort Myers Cape Coral Real Estate Current Market Index


The December 2008 Ellis Team SW Florida Real Estate Current Market Index again showed improvement from last month’s index.  The Current Market Index now stands at 6.65, down from 6.89 in November.  The lower the number the better the market is for sellers.  Transactions in the Fort Myers and Cape Coral real estate markets were up again significantly over last year as our index predicted it would be.  Single family home sales in Fort Myers and Cape Coral were up 78% over last year’s numbers in October.

Single family inventory is down 12.42% from last year’s numbers.  In December 2007 we had over 16,000 single family homes for sale in Lee County and now that number is down to slightly over 14,000.  With sales up around 80% over last year’s numbers and inventory declining, many would say that 2008 has been a year of recovery for the SW Florida real estate market, but we cannot do so until prices stabilize.  Median prices have continued to head lower all year and this is why Fort Myers and Cape Coral has bucked the state and national trends, because value and affordability are back in the market.

In fact, prices are so far below replacement costs that first time home buyers and investors alike are scooping these properties up as fast as they come on the market.  While more foreclosures are scheduled to hit the market in 2009, many are condominiums and vacant land.  We are doing a study right now along with the SW Florida Real Estate Investment Association to determine how many Lis Pen dens filings are actual home foreclosures.  Keep in mind, a property may have multiple Lis Pen dens filings which may skew the numbers, so we may not see as many foreclosures in 2009 as some are quoting.

Local mortgage companies are reporting fixed rates in the 4.5% range today with 1 point.  Loan amounts are also on the rise, which could signal an up tick in future home buying in higher price ranges.  We don’t look for drastic upward changes to median home prices, however we do like to look at mortgage applications to get a reading on potential future purchasing activity.

We see regular negative articles and news stories about the real estate market, but the numbers tell another side of the story.  Sellers do not like today’s prices, and nobody knows where tomorrow’s prices will be for sure, however we can report there is a market at the right price and this market has been posting large gains all year.  We think many buyers and investors have figured out there are tremendous buying opportunities available now and they’re not listening to the Downers in the market.

If you really want to know how a market is doing, follow the money.  Buyers are back in this market because the prices are Right.  It’s a lot like the BCS polls.  Don’t follow what the polls say; follow the Vegas odds, because that’s where the money is.  It’s amazing how much better the money does in picking games than the experts do.  The numbers always tell a story.  The real wisdom is deciding not which expert to listen to, but which numbers you should follow.  In the SW Florida real estate market you can look at falling median prices, or increased sales.  Both tell a story, and we’ll leave it to the market to decide what the numbers mean.  We just thought we’d present another side you may not be seeing in the media or hearing from other experts and let you decide.

The October 2008 Ellis Team Current Market Index shows slight continued improvement in the SW Florida real estate housing market.  The index went down to 7.27, down from 7.75 the month prior.  The lower the number the better it is for sellers, and the higher the number the better for buyers.

Ellis Team SW Florida Real Estate Current Market Index Fort Myers Real Estate

Cape Coral real estate led the way with a market index of only 5.93, down from 6.38 in September.  Fort Myers real estate stands at 13.13, down from 13.76 in September.  There is currently 15,570 single family home listings in Lee County, up from 15,530 in September, so listing inventory is remaining relatively steady.  Pending sales in SW Florida rose to 1700, which is a very good sign going forward.

It’s important to keep in mind that many of these sales are a result of foreclosures hitting the market at affordable prices.  These listings are replacing short sales that were not sellable, and once they become sellable and affordable, the market gobbles them up.

It is still a tough environment for agents though as marketing costs remain high, gas prices remain high, and sale prices are half what they used to be.  Add in financing troubles and many times the agent has to sell the home more than once to get that one sale.  So bottom line is margins are tight, workload has doubled which adds administrative costs, and prices are down.  This is perhaps why there is a flight to quality by home sellers to top agents capable of selling in a tough market.  The same is true with mortgage professionals and title professionals, as only the strongest have survived in this market.

 We are noticing seasonal vistirs again, and may are inquiring about buying this year as prices are much more to their liking.  They’ve held off in past years waiting for the bargains, snd this year will be the year of bargains for our northern friends.

We beleive there may be pent-up demand from northern buyers as we are still receiving calls from our NBC Nightly News  with Brian Williams report we did last week showing affordability is back in the market, as well as The NBC Today Show we did a few weeks ago.  We also did a piece this past week for ABC-7 News on Sales up and Home Prices Down.

The latest Fort Myers Cape Coral SW Florida real estate Current Market Index has been released today and the overall Fort Myers Cape Coral housing index numbers fell to 7.75, from 7.88 the month prior.  Cape Coral again led the way as Cape’s index fell to 6.38 while Fort Myers stands at 13.76.  The lower the number the more favorable it is for sellers, and the higher the number the more favorable for buyers.

Current Market Index for Fort Myers Cape Coral Area


Fort Myers Cape Coral SW Florida real estate current market index chart

Lee County listing inventory for single family homes remained steady at 15,530 up a mere 7 homes from last month, and pending sales increased to 1,617, up from 1,546 in August.  The overall Lee County Florida Current Market Index is at 9.60 in September, down from 10.04 in August.  The September condo index stands at 20.21, up from 19.27 in August.

These numbers tell us the overall market is basically holding steady to slightly improving since August, and should bode well for closings in future months.  It also tells us that so far the market has been absorbing the influx of foreclosures and selling them as they are not adding to inventory supply.  This is another positive sign as the local SW Florida real estate market would be in trouble if the foreclosure activity added to inventory supplies.  The large number of foreclosures is however keeping the supply where it is and preventing it from declining.

The August SW Florida Real Estate Current Market Index is out for Fort Myers, Cape Coral and Lee County real estate, and as you can tell, it’s been fairly level but weakening slightly, which should lead to strong sales numbers going forward, but not quite as strong as we saw in the summer months.

Ellis Team SW Florida Real Estate Current Market Index August 2008 Fort Myers Cape Coral real estate

The official index climbs slighty to 7.88, up from 7.51 the month prior.  The Index consists of Fort Myers and Cape Coral combined.  The overall Lee County index stands at 10.04 for single family homes and 19.27 for condos this month.  Fort Myers single family homes index is 12.89 and Cape Coral is 6.62, so Cape Coral is definitely the hottest part of the county for sales compared to inventory levels.  Lehigh Acres numbers are reflected in the Lee County numbers.  The graph depicts Fort Myers and Cape Coral  real estate single family home sales index numbers.

We’re predicting sales to remain good, but cool off slightly.  Financing is having an impact on current pending sales, and new sales will be tougher after October 1 when down payment assitance goes away.

Fortunately we do have some homes listed that are foreclosures and the credit union is willing to finance with only 2% down, and will offer low rates to buyers with less than perfect credit, so this is a very good program for buyers who may get squeezed out of qualifying or who cannot come up with the minimum down payment due to the new financing rules.

The Ellis Team SW Florida real estate Current Market Index leveled off in July to a 7.51 mark, up slightly from the 7.23 numbers in June.  The lower the index the better it is for sellers, and the higher the index the better it is for buyers.  We witnessed 5 straight months of decline before this leveling off.


SW Florida Current Market Index July 2008 Ellis Team RE/MAX

Single family listings in Lee County Florida rose slightly from 15,634 to 15,668, while pending sales dipped slightly from 1,697 to 1,574.  Both factors contributed to the slight uptick in the CMI index.  This could be somewhat seasonal.  We’ve also noticed a surge in investors swooping in to buy distressed bank foreclosures in recent weeks, which could be a positive sign.  Investors tend to be less emotional and more analytical about the numbers, and their comfort level with today’s prices speaks volumes.  It is important to note that these pending sales have been translating into significant increases in closing volume of 2007 levels.  Home sales in Lee County were up 43% in June over last year’s numbers, following up on a big increase in May as well.  Prices are down and volume is up.

The CMI index in Fort Myers actually improved, while Cape Coral softened just a bit.  Listing inventory of single family homes declined in Fort Myers from 2,528 to 2,489, while inventory in Cape Coral rose from 5,092 to 5,104.  Pending sales dipped slightly in the Cape while they held steady in Fort Myers

Official May 2008 sales numbers were released for SW Florida, Fort Myers and Cape Coral, as well as the entire state of Florida.  We predicted a 57% increase in the number of sales and a 25% decrease in the average sale price in Official SW Florida Real Estate Sales Numbers Due Out Tomorrow post on June 25.

As you can see from our Florida Sales Report – May 2008 Single-Family, Existing Homes, official home sales were up 43% and the median sale price was down 25%.  The official numbers use statistics from various sources and we analyzed statistics from the Greater Fort Myers and the Beach Board of Realtors.  We knew our stats would be close to official numbers and while the number of sales was a little off, the trend was overwhelmingly positive no matter how you look at the numbers.

We posted a new Ellis Team Current Market Index on June 20th, and the prognosis for continued strong sales activity persists.  Condo sales were up 32% and median sale prices of condos in SW Florida were down 9%.  See Florida Sales Report – May 2008 Existing Condominiums   For additional housing statistics in Fort Myers and Cape Coral real estate, see our Housing Statistics page.  If you’d like to search for property in SW Florida, including Cape Coral, Lehigh Acres, Fort Myers, Estero, Bonita Springs, and all of SW Florida, visit our SW Florida MLS Property Search Website.

If you’re interested in Bank Owned Properties and Bank Foreclosures throughout Fort Myers, Cape Coral, and Lehigh Acres, visit our Bank Owned Bargains webpage.