Season felt like it was good but statistically the numbers weren’t coming in like they usually do in the Fort Myers and Cape Coral real estate market.  February and March sale prices were flat and this is the time of year they usually rise. We reported that was a trend we wanted to keep an eye on.

Cape Coral real estate market homes closed

Other Factors Influencing the Fort Myers and Cape Coral Real Estate Market:

Another trend we were watching was the weather up North. This past winter was frightful in every aspect and many speculated this would be a boom for SW Florida, including us. The numbers weren’t as strong this season as the weather was dreadful, so some were scratching their heads.

At an Ellis Team meeting a few of our buyer specialists were commenting on how many of our buyers were done with living up North, but the weather was so bad they couldn’t leave. They longed for the day for the weather to improve enough so they could plan a trip down to paradise.

Guess what? Many of them did just that and our sales started rising. The last few days of April and the first week of May were particularly strong, and we haven’t slowed down since. Some of these sales were Northern buyers coming down. Others were local buyers making their move.

Fort Myers Sale Prices 2014 Cape Coral

In any event, we’re starting to see the charts move again. It’s too early to tell if this is a trend as closed sales tend to peak in April and May then simmer back down for the rest of the year. The same is true with prices as Northerners snatch up higher priced homes during season.

We are seeing pending sales going up right now on our team.  Countywide inventory is going down, so this may bode well for home sales going into June and July.  Prices may follow suit, and if this holds true, it bolsters the idea that perhaps 2014 is in for a late season.

Years ago summer was the hottest selling months for single family homes.  We might be returning to that model. Of course, years ago the locals freely bought and sold in the summer months when all the tourists went home because they had more time. Many locals work hard during season and things free up a bit when they go home.

For the last 7 years or so locals weren’t able to buy and sell in the summer because they were under water on their home, or their business hadn’t fully recovered yet.  Now more and more are able to sell as they finally have equity due to rising prices and paying down their mortgage. Each year going forward we may see more and more eligible locals in the market.

At the Ellis Team at RE/MAX Realty Group we’ve been listing homes and they’ve been selling quickly.  This could be a good sign. We’ve been excited to show off our new Hi Definition marketing program and we’ve been having trouble keeping our new listings long enough to video them. We do have some videos coming to the market you can check out at www.HomesinHd.TV

We are seeing increased activity from online leads as well.  I just went in and searched our online MLS search site and we had 17 new registrations in the past 2 days, so that’s about 8.5 per day.  That’s a healthy number signing up to view homes in MLS so that may be a sign there’s increased interest in the SW Florida real estate market as well. If you’d like to search the MLS, go to Topagent.com

We hope everyone has a happy and safe Memorial Day weekend, and remember Memorial Day is a day to remember US armed forces who died serving our country.

Good luck and Happy House Hunting!

To search the MLS visit TopAgent.com  To learn more about Hi Def video for your home visit HomesinHD.TV

Visit our Google+ Business Page
Search the MLS

Search For Homes in Reflection Lakes Fort Myers


View Larger Map
Feel free to view our Virtual Tours .

Fort Myers Real Estate Agent

Is the SW Florida Real Estate Market Changing? Listing inventory rose slightly in Fort Myers and Cape Coral real estate markets in February from 6,192 single family homes on the market in January to 6,271 last month. Listing inventory typically peaks in January and declines slightly in February before Declining rapidly in March due to so many seasonal sales occurring. This year inventory actually rose in February and internal numbers we’re tracking in March show they’ve risen slightly again.

SW Florida real estate market single family home inventory

This may be a sign that sellers have been a little too ambitious pricing their home and buyers have backed off bidding up prices. Prices typically peak in season then level off or decline a little bit the rest of the year. This is because most of the higher priced sales occur when we have the most visitors, but if that trend is peaking it will be interesting to see where the market heads from here. New pending sales in February are down 10.6% from last year. New listings are up 5.4% over last year. So we have increasing inventory and declining pending sales in the height of season. We’ll be tracking March numbers very carefully. It’s still possible March and April could be great as Easter is late this year but the pending numbers we’re looking at don’t bear that out plus we see rising inventory.

SW Florida real estate market new pending sales and Cape Coral, Estero, Fort Myers Beach single family

SW Florida Real Estate Market Prices

Prices did rise in February up to a median price of $185,000 from $180,000 in January. Average prices rose from $301,035 in January to $311,536 Has the market peaked? Markets rarely stay constant. It’s possible the market is taking a break until it figures out where it wants to go. Properties in the $250,000 or less range are still flying off the market. Homes priced higher than $400,000 really need to make sure they’re priced competitively in the market as inventory begins to build the higher the price. Interest rates are rising again and it has put pressure on buyers. We just received some good news on flood insurance which will help the SW Florida real estate market compared to what we could have seen had the President not signed HR 3370 into law this week. New buyers will receive the same flood rates as existing homeowners do. Rates may still climb, but there are caps to how much and how fast, and before the new law was signed, there was no grandfather clause when a purchaser bought a property. This should provide some stability to costs for buyers which does affect their purchasing power. We’ve had some excellent weather down here and the weather up North has been dreadful. 2014 might be the year many will vacation down here and put plans into place to move here in the coming months. A few companies are also bringing jobs to SW Florida in the next few years. If the economy improves, our real estate market has more room to grow. If it doesn’t, our market may stagnate and remain at these levels. Like I said, the market rarely stands still. Forces affect the real estate market. Rising interest rates affect it negatively. Jobs and the economy do affect the market as well. We’re not sounding the alarm that we’re at risk of a downturn. We are saying we’re watching the numbers and we have a few things to keep our eye on going forward. The continued trend of rising prices may still occur, or it may subside and take a breather.  If your plans depend on one outcome or the other this is information that may be useful to you. Nobody knows where the market is going exactly, or exactly when it will get there. If you’ve got a property to sell, give us a call and we’ll guide you through the market. If you’re a buyer, it pays to know what areas are hot and where inventory is building. We have the information. Let it work for you. 239-489-4042 or search the MLS at www.swfloridamls.Topagent.com Good luck and Happy Selling/Buying! If you’re considering buying or selling in Fort Myers, Cape Coral, Estero, Ft Myers Beach or anywhere in Lee County Florida, give us a call. 239-489-4042 or visit our website www.Topagent.com Search the MLS View Larger Map Feel free to view our Virtual Tours . Visit our Google+ Business Page  

Some might look at recent SW Florida single family home sales numbers and wonder if the market has peaked as sales have slacked off a bit, but let’s not jump to conclusions just yet. This week we take you inside the numbers and explain what’s happening and what we’re keeping our eyes on.

Are SW Florida Real Estate Sales in Trouble

Homes Sold single family Bonita Springs Estero Florida Fort Myers Cape Coral

As you can see from the Homes Sold graph, sales are down. This is somewhat expected as inventory is down and agents have been selling more new construction to satisfy home buyer’s needs. 2013 sales numbers dipped in January but rebounded nicely going into season leading up to a fantastic May. This could happen again this year.

Should sellers beware? Maybe. While you can definitely see the seasonality of home sales, there is no doubt the rising home sale prices will limit buyers, as will rising interest rates. Rates are expected to rise even more in 2014.

Pending home sales graph Lee County Florida

We also looked at pending sales in December 2013 and January 2014 as this is an indicator of potential future closings in the coming months. Pending sales were down 16.4% year over year in December, and down 6.4% in January. Again, this is a short time frame to look at, and some of this could be attributed to limited inventory, however it could impact reported closings going forward.

We really want to look at how February sales come in which won’t be reported for another 3 weeks or so. Prices will probably be higher and sales could be lower than last year. January thru May sales set the trend for all year, so we’re keeping a close eye on trends these first few months.

Yes, we’ll probably have rising prices. Prices rose again in January to a $180,000 median price and a mean average of $301,035. That’s up roughly 25% or better for both numbers over last year.

Are rising prices limiting sales? Is limited inventory holding back sales? Is new construction competing with existing home sales again? Are rising interest rates limiting sales? Nobody knows the answers yet. We’ve identified some indicators to watch though.

If you’re a seller, you might want to look at how well your home competes against other similar homes on the market. A few weeks ago we posted on our Blog inventory levels by price range. If you have a $ 1 Million+ home there is currently about a 3 yr supply of homes on the market, so you have to look at what you need to do to sell your home versus waiting 3 years. And what if the market falls within 3 years or more listings come to the market? It could take even longer to sell at reduced prices.

If your home is in the $400-600,000 range, there is about a 1 year supply of homes. Again, it pays to know your competition and price accordingly. Our market has been doing well the past few years. 2014 looks to be another good year, but don’t take price gains for granted. There is no law that says prices will rise forever. New construction is now competing against you again for the first time in years. SW Florida may return to a more moderate market, which is probably best anyway.

We’ll keep tracking the trends, and as always, if you need assistance buying or selling in SW Florida, Always Call the Ellis Team. 239-489-4042 or www.TopAgent.com

Good luck and happy buying/selling!


View Larger Map
Feel free to view our Virtual Tours .

Visit our Google+ Business Page


For the 3rd month in a row median sales prices increased in SW Florida.  Median sales prices are up 24.8% over last year so it’s safe to assume all properties in SW Florida are sky rocketing, right?  Not so fast.  Media prices county-wide are increasing, but that doesn’t mean every property is going up.

September 2013 Real Estate Sales Numbers Just Released for SW Florida

September 2013 Real Estate Sales Numbers Just Released for SW Florida

Average sales prices are coming down.  Since April the average sales price is down about $60,000.  So how can two sets of data tell two very different stories?  The answer is, they’re not telling two stories.

Average sales price is influenced by high end sales.  If there are several multi-million dollar sales it can skew the average up.  When using the median price, it really doesn’t.  Let’s say for example there are 10 sales of 5 million dollars+.  That’s at least $50 million in sales in just those 5 sales.  By using the average, that adds $50 million to the total number, but by using the median it just counts as 5 sales at the top.  Remember, median sales are the number in which half the sales occur at or below a certain price and the other half are at or above that price.  When we use average they all get thrown in together and divided by the total.

The average price is more seasonal because that’s when our high end buyers are visiting Florida and purchasing higher end homes.  This is why you’ll always see the peak of the average market around March-May.  They typically go to contract January through April and close March through May, sometimes even June.

Realtors like to use the median price because it’s more stable and less affected by a few sales.  Median prices have been fairly constant to the upside.  Even the median can have fluctuations if certain closings get delayed.  A government shutdown for instance could delay certain types of loans which would disrupt closings.  One year we had flood insurance coverage lapse and we couldn’t close until the program opened up again.

Speaking of government shutdown, the government is open since last time we wrote an article.  Yeah!!!!  Don’t hold your breath though as we might be right at it again in a few months.  November is shaping up to be a big month for the Ellis Team.  Let’s hope that’s indicative of the entire market.  Buyers have been particularly active in recent months.  October has been a good month too, but November is shaping up to be fantastic.

Inventory is on the upswing, which is good.  We need more inventory to sell.  We’ve even been going out to developers and builders looking over their inventory as sometimes we just don’t have much to sell in certain price points with certain features.

If you’re considering selling, now might be a good time to call us. 239-489-4042  We recently listed a home that was previously on the market but failed to sell with another Realtor.  We raised the price and marketed it using our advanced marketing system and it sold in 19 days.  If you price it correctly and market it where the buyers are, it should sell today.  Call us while prices are rising and before interest rates creep up next year.  Good luck and Happy Home Selling!

To search the MLS for properties go to www.TopAgent.com or give us a call at 239-489-4042     Good luck and Happy House Hunting!!!

Feel free to view our Virtual Tours .

Visit our Google+ Business Page


Official August 2013 SWFL sales numbers  have been posted from Florida Realtors and as expected the Fort Myers and Cape Coral real estate market is holding its own.  Listing inventory is down again and it’s causing prices to rise.

August 2013 SWFL Sales Numbers

Single family home listing inventory stands at 4,956 currently compared to 5,763 last year.  That’s a 14% drop in listing inventory.  Median sale prices rose 32.1% in the past year.  June sales numbers indicate a median sales price of $185,000 compared to $140,000 last year.  Average mean sales prices increased 17.1% to $271,896

Mean sales tells me that there were less higher priced homes selling pulling the mean average up because the mean average only went up 17.1% while the median average shot up 32.1%

In either event lower inventory and strong demand are pushing up home prices.  Builders have reported strong sales this year and are filling in the gap as current demand is outpacing current supply.

As prices rise and inventory dwindles look for building construction to pickup again this year.  While building is taking the pressure off the resale market and should continue to do so moving forward, there is some risk in the construction industry.

Building a home today takes approximately 6-9 months from contract to completion.  Most builders require a down payment to begin construction.  There are two ways to finance new construction.  One is called an end loan and one is a construction/permanent loan.  Today the most common is the end loan whereby the builder uses their own money to construct the home and the buyer obtains one loan at closing.

The problem with an end loan today is there is no way to predict what interest rates will be 6-9 months from now. Rates have gone up over 1% in the past month or so and we expect them to rise again as the Fed curtails buying mortgage backed securities which has artificially kept rates low as the Fed has tried to stimulate the economy through lower interest rates.  The Fed has announced on two separate occasions this summer their intention to stop this program once there is recovery in the economy, and we are seeing some mixed signs of recovery.  Just when the Feds will kill this program has led the markets to speculate and bid up rates.  Rates are determined by the value of the security.  When the value is bid lower the return (or rate) goes up.  10 yr note buyers have been paying less than they were a few months ago due to volatility in the markets.  The Fed has fired the warning shots over the bow and the markets have responded.

We knew this day was coming, we just didn’t know when.  With uncertainty in the interest rate market, it’s impossible for buyers to know how much more their borrowing costs will be next year when a house is completed.  It can make the difference whether a buyer qualifies for the mortgage at all.  The buyer may qualify today and not next year when the house is complete, so the builder is taking a big risk.

A buyer doesn’t know how much they need to scale back today so they qualify next year.  Imagine being a buyer and being told you qualify for a 3,000 sq ft home, however because rates are going up you need to scale back to a 2,500 sq ft home, or maybe even less.  Perhaps you don’t like the 2,500 sq ft floor plan the builder is offering.  You don’t want to sacrifice your lot location, or the pool you’ve chosen.  What do you cut back on today, and how much?

This is the dilemma buyers are faced with today.  It is terribly expensive to lock in a rate longer than 45 days out, which most builder homes are going to be.  This is pushing many buyers back to resale homes, and we have a shortage of inventory.  It’s a double edged sword.  If you’re a buyer paying cash you have more options and aren’t as concerned with rates.

If you’re a buyer or seller needing to talk to a professional about your options, give us a call at 239-489-4042.  We’ll be happy to help you sort out your options.

Good luck and Happy Buying/Selling!!!!

Visit our Google+ Business Page


Lately we’ve been focusing on the local real estate market as we know all real estate is local.  However, sometimes the national market helps us spot trends that may affect us in the future. National Housing Market Update.

National Housing Market

When Northern markets have struggled in past years it made it difficult for some buyers to purchase down here because they no longer had the equity they used to have in their current home or they just couldn’t sell their home to make the move down here.

RE/MAX International releases a national monthly housing report which is a survey of 52 metropolitan areas. The latest report released in July shows transactions were up 4.1% over last year even though they dipped from May 2013 levels.

This dip could be due to limited inventory nationwide.  This year there are 23.9% less homes on the market. This would explain why we have only 3.0 months supply of inventory nationwide.  This low supply typically indicates a sellers market.

Rising rates may curtail transactions somewhat as less people qualify for what they used to just a few short months ago.  Fannie Mae did a study that said this theory isn’t true.  Sometimes rising rates act as a motivator.  Inventory levels are probably the biggest threats to transaction volume right now.

Local numbers haven’t been released at the time this article is written.  Our internal analysis suggests a 30%+ rise in price over last year with all price ranges except for $100k and under posting fair to large sales gains.  The reason the under $100k market is posting losses in sales is because with recent price gains there are fewer lower priced homes to sell.  We saw exceptional strength in the $600-1 Million price range as well as the $250k-$400k range.

We have 14% fewer active listings and a 17% rise in new pending sales locally.  This too should drive prices higher going forward.

To relieve some of this pressure builders are seeing more activity.  Going forward building will become a viable option.  The only downfall to building is locking in the interest rates.  If it takes 6-9 months to build a home there is a significant amount of time rates could rise.  Remember, a 1% increase in rates takes away about 9% purchasing power, so a buyer has to be careful when they select their home today that they can afford it when the home is completed.  Locking in rates that long is almost impossible and costly if more than 45 days out.

Perhaps builders will offer interest rate protection one day but either way it’s built into the price of the home.

More than 800,000 homeowners regained positive equity in their home in the 1st qtr of 2013.  This could spur more sellers to enter the market.  Many homeowners have been trapped in their home and can now afford to make the move.  Many are motivated to beat the interest rate hikes.  Even if they wait for their home to go up a little bit more in value it still costs them to wait as the home they’re buying is also going up as are the rates to finance it.  Waiting is a double whammy for a seller right now.

If you’re thinking about making a move in today’s market, give us a call at 239-489-4042 We’ll show you your options and you can decide if a move makes sense for you right now.  It always helps to get the facts before deciding one way or the other.

Good luck and Happy Selling/Buying!!!

Visit our Google+ Business Page


It’s been almost 2 months since we covered the SW Florida housing supply and even longer since we covered the traditional sales versus distressed sales with breakdowns by month. Since both affect our market and tell a story, we thought we’d revisit the issue which may lead to clues on where the market is heading into season.

Months Supply of Inventory SW Florida

Listings for single family homes and villas has increased by about 500 in the past month which has increased the months supply of inventory to 3.8 months, up from 3.5 months the previous month. When new inventory hits the market there is a lag because we calculate past sales into existing inventory to derive this number. Since the inventory wasn’t available to sell until now, there’s no way it could close. Because properties are being scooped up almost as fast as they hit the market, the months supply will come down, all else being equal.

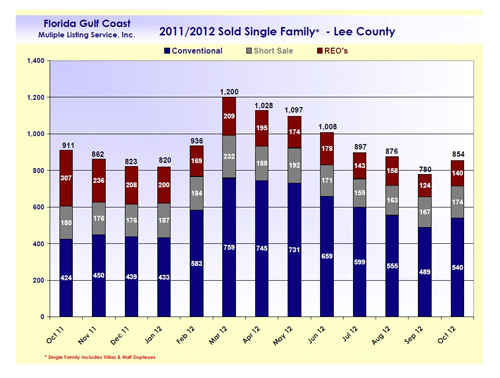
When we look at the breakdown of sales by month, we see traditional sales rising by 96 sales over last October. Short sales are roughly the same, but you’ll notice a big difference in foreclosures, or REO’s (Real Estate Owned). Foreclosures are less than half of what they were last year, and traditional sales are rising as prices increase. More sellers can afford to sell as the prices rise.

Breakdown of SW Florida Traditional Sales, REO, and Short Sales

Banks have worked hard at accepting short sales in lieu of having to sell at foreclosure months later. Because the SW Florida real estate market was artificially too low, there has been upward pricing pressure. This is why median sale prices jumped $10,000 in October over September. Heading into season we could see more of the same.

We know prices fell too far because they were far below replacement cost, which essentially cooled the jets of the building industry for a several years, however now that prices are rising builders have found ways to build again at lower cost points.

With each rising price point it becomes feasible for builders to build again. Building bolsters our local economy in so many ways, so it’s nice to see that, especially since building was such a large component of the SW Florida economy.

The SW Florida real estate market is set to take off even further once the overall economy improves. We’re seeing price gains now simply because we were undervalued. We’ll see more once traditional demand picks up. We think there is pent-up supply and pent-up demand just waiting to attack our market. Both will rise as the economy improves, and each may temper the other. We have many sellers who would like to sell once prices rise enough to cover their mortgage. They are current on their payments but strapped in their home.

We have buyers who’d like to buy but need to sell a home first, or are just waiting until they feel better about business. You’ve heard the term a rising tide will lift all boats, and the same is true with the economy. Once that happens, this market could blast off.

Good luck and Happy House Hunting!!!

Well, it’s that time of year again and the tropical season is heating up.  Because we have an impending storm approaching we decided to do a video on Hurricane tips for agents and the public alike.  We hope these tips will help you prepare for this storm or any others that may come our way.

Hurricane Tips for SW Florida


If you’d like market information on SW Florida including the Fort Myers, Cape Coral, Bonita Springs real estate market and how it stacks up against the national real estate market be sure to  watch our National Housing Report

The past two weeks we’ve written Top Tips of Selling Your Home and Buying a Home. This week we thought we’d focus on where the market is headed as so many have asked for an update on the market.

Prices in 2011 were up all year since February and never looked back. Most buyers realized the bottom of our market was back in 2009 at the height of the foreclosure crisis. Inventory has fallen dramatically although it has risen again which is a surprise to many.

Fort Myers - Cape Coral Pending Home Sales Chart
Pending Home Sales in Fort Myers- Cape Coral

Attached is the pending sales chart. As you can see, pending sales are up 15.44% over the previous month. Looking back, February always sees a jump in pending sales as the Northern Snowbirds are here in mass every year when our weather is beautiful and it’s cold up North. This year, we started noticing seasonal visitors back in October which was an early start.

While the pending sales chart doesn’t show it, people have been here looking for months. We believe they realize Florida is still relatively inexpensive compared to 2005 levels, but prices are rising and nobody wants to miss out on a good deal. Unfortunately, we have less inventory to sell, so not all are leaving with a deal. In fact, several commented they wished they would have bought last year as prices are definitely higher and selection is definitely less.

SW Florida Distressed Sales
SW Florida Real Estate Distressed Sales

We still get calls from buyers looking for $25,000 properties 3 blocks from the beach. We’re not quite sure which website they’re looking at. The only thing we can guess is maybe it’s a 2008 or 2009 version that hasn’t been updated. Maybe they’re reading old headlines, or headlines about falling prices up North. Whatever the case, they’re convinced our agents are holding out on them and they move on to call other agents who they think will have those old deals for them.

The reality is the market moved on. The market rarely stays in one place, it is always in flux. Look at the Lee County Total Distressed Sales Chart. Last month only 44.84% of all single family home sales in Lee County were distressed compared to 71.86% back in June 2009. We have seen a rise in traditional sales combined with a fall in foreclosures available to sell which has contributed to higher prices.

We’ve actually seen more homes being built because of higher price points, declining inventory, and builders have been able to cut costs from suppliers and workers looking for work. While building activity has increased, it’s still a far cry from where it was back in the prime of the market.

We’ve got dozens more charts we could share but only so many would fit in a one page article. Suffice it to say that SW Florida is looking up a bit in housing. Our economy seems to be doing mildly better as well, which we ultimately need to fuel and sustain any housing run-up.

We know more foreclosures are on the way, but nothing like what we saw back in 2009. We have a slight backlog due to legal slowdowns because of the robo-signing issue. The market is easily absorbing all new foreclosures we bring to market and in fact has a thirst for more. We don’t believe this thirst will be quenched. We believe this year will produce a good season and hopefully things will continue on.

This is an election year, and the unknowns are always tax laws, gas prices, instability overseas, and the future of our economy. Absent the wild cards, our market looks in good shape and is healing in a positive way. This healing may be slow for some sellers, and fast for some of those buyers looking at outdated headlines or websites, however it is occurring at a healthy and sustainable pace. It is a process that had to occur, and thank God it is occurring.

Whether you’re buying or selling, it pays to get the facts. A mistake will cost you. Each neighborhood can be different, so be careful about relying on countywide information. It may or may not apply to the home you’re considering buying or selling.

Good luck and happy house hunting.

As you can see from the attached chart, the percentages of sales that are distressed are rising once again.  This isn’t necessarily a bad thing as we believe banks should actively work with sellers to allow short sales rather than going through an arduous and costly foreclosure process that ties the home up for months or years.  If the homeowner simply cannot afford to stay in the home and all other realistic options have been exhausted, banks should assist in allowing current homeowner to sell to someone who can afford and wants to be in the home, and everyone wins including the neighborhood.

Distressed Sales Chart for Greater Fort Myers, Cape Coral Florida
SW Florida Distressed Sales

Official sales numbers will be released after we write this article.  Our internal market research suggests sales will fall in July compared to June by about 216 +/- homes and median prices will fall slightly as well.  This may be a function that foreclosures made up a larger portion of the distressed sale pie than in previous months, signaling short sale percentages declined versus foreclosures.

Banks are beginning to release more foreclosures as they’ve turned a corner in the legal battle when they went back and cleaned up the process to file foreclosures.  We all knew there would be some pent-up foreclosure supply, but nothing along the lines of 2008-2009 foreclosure filings.

Cape Coral saw almost a 5% increase in distressed sale percentages while Lehigh Acres was up about 3%.  Overall sales were down in Lee County, but the breakdown of the sales was leaning more towards distressed sales.  County wide distressed sales equaled 48.82% of all single family home sales in July, up from 44.57% in June.

Contrast this with listing inventory in Lee County and you would think there would be upward price pressure as inventory levels dwindle.  It’s fascinating to watch the economic dynamics in play.  A similar analogy might be predicting hurricane’s forecast trajectory plot and intensity.  A storm can be influenced by dry air, low pressure, ridges anticipating forming at a certain time and point, and so forth.

Single Family Listing Inventory Fort Myers- Cape Coral
SW Florida Listing Inventory

Forecasting the SW Florida housing market has similar variables influencing the market.  We have banks processing foreclosures as fast as they can, banks willingness to accept short sales, traditional sellers moving up, down, or not at all depending on how much they owe and their job security, and the overall job market.  Are jobs moving into the area or out of?  When will the economy improve?  Interest rates and insurance costs also influence affordability and motivation for buyers.

Predicting the housing market would be so much easier if you could accurately predict each individual variable.  Since we cannot, all we can do is monitor local and sometimes world events and report on how they are affecting the real estate market.  In past articles we’ve talked about the effect of United States debt on interest rates.  We’ve talked about the price of oil’s effect on the economy, and housing supply issues.

As we enter an election year, hopefully the focus will be on the economy and jobs, and if Washington gets out of the private sector’s way and allows it to grow, maybe, just maybe, we’ll see a positive influence on several variables that influence our local real estate market.